Fortune 100 North American energy company Transforms Network Operations with AI Agents
How a Fortune 100 North American energy company replaced tool-hopping operations with multi-agent orchestration - and got more out of the Splunk it already owns.
Highlights
- VPN root cause in ~3 minutes; VDI access issues analyzed in ~5 minutes
- Five named agents in production on daily, hourly, on-demand and continuous cadences
- A shelfware Splunk ITSI deployment now in daily use, its service map generated and maintained by Fabrix.ai
- 12,675 assets discovered; 200+ applications and 40+ plant networks modeled automatically
- Fully managed SaaS, straight to production with no prolonged POC
Customer Snapshot
| Industry | Energy & Utilities (Fortune 100, NYSE-listed) |
|---|---|
| Scale | 25,000+ devices, 27+ sites, 10+ VPN gateways, 3,300+ VPN users |
| Data estate | 1.7B+ events a day, 18+ Splunk indices, 15+ tools integrated |
| Deployment | Fully managed SaaS on AWS, with on-prem worker nodes |
| Go-live | Direct to production - no prolonged POC |
The Challenge: Data-Rich, Answer-Poor
The Energy Company runs a large multi-site estate from a central NOC. Splunk, Dynatrace, Cisco, ServiceNow and ThousandEyes were rich in data but siloed, and the network was often blamed for VPN, VDI and application issues that originated elsewhere.
- Every investigation meant swivel-chair correlation across 8+ platforms.
- 1.7B+ Splunk events a day, with no direct path from data to answers.
- VPN and VDI issues escalated to senior engineers once help desk playbooks ran out.
- Each Cisco security advisory needed manual inventory cross-referencing.
The Solution
Fabrix.ai deployed its Agentic Platform as an always-on layer over the tools already in place. More than 25 sources feed it: most telemetry arrives through 20+ Splunk indices, and inventory, topology, alerts and ITSM data connect directly through 10+ integrations.
- Splunk + ITSI - existing data, with services, KPIs and episode policies automated
- Enterprise Ontology - a knowledge graph of multi-domain topology and dependencies
- MCP tooling - every system made agent-accessible, with 1000s of dynamic tools
- Teams Copilot - natural-language operations and automated notifications
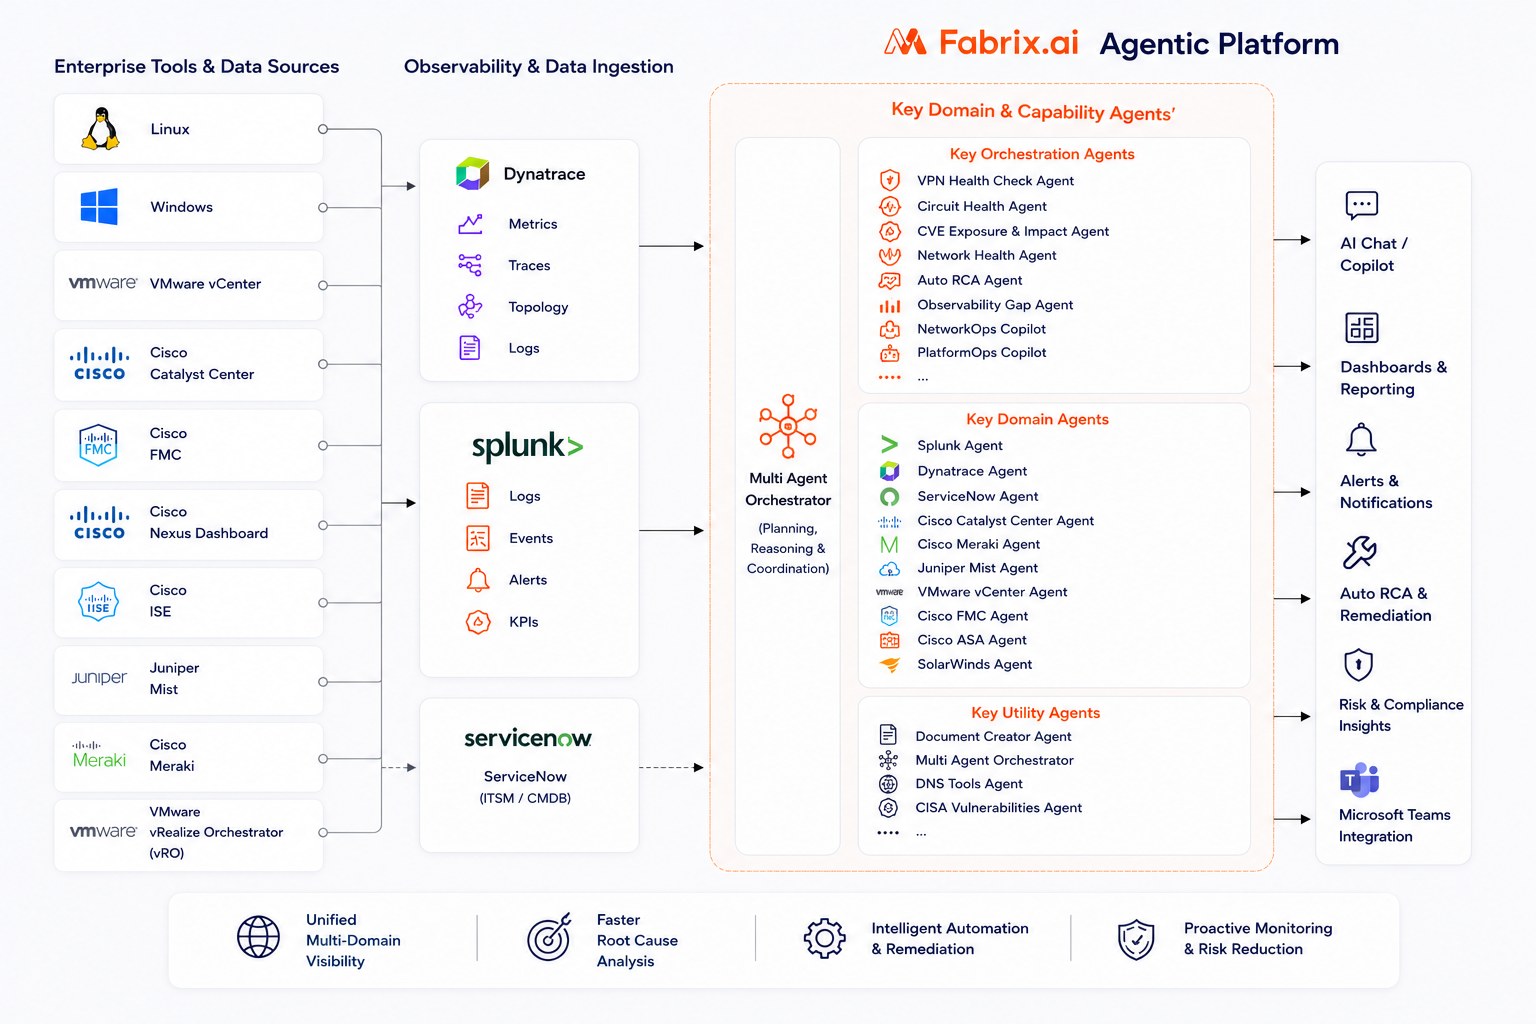
| Domain | Sources |
|---|---|
| Network & wireless | Catalyst Center, Meraki, Juniper Mist, Arista, VeloCloud SD-WAN |
| Security | Cisco FMC, Palo Alto, Cisco ISE, ClearPass |
| Data center & compute | NDFC / Nexus, VMware vCenter, Windows, Linux |
| Cloud & workspace | AWS, Azure, Citrix |
| Apps, ITSM & circuits | Dynatrace, ServiceNow, SolarWinds IPAM, ThousandEyes, MetTel, WhatsUp Gold |
A Living Ontology and an ITSI Map That Stays Current
The Application Asset Ontology maps every application, the assets behind it, and the indices that should describe it - showing where each signal lives, whether it is current, and where the blind spots are.
- 12,675 assets discovered
- 207 DR applications
- 1,370 assets mapped to applications
It also exposed two Splunk indices reporting zero events for 23 of 24 hourly buckets - a gap nothing had alerted on.
ITSI had been licensed but unused: the modeling effort was the blocker. Fabrix.ai now derives services, entities and KPIs from the ontology and writes them into ITSI, so the map reflects what is actually there and keeps up as the estate changes.
- AppOps (live) - 200+ applications across five criticality tiers, each with Splunk, Dynatrace and agent-reported health KPIs.
- NetworkOps (live) - corporate, data center and VPN networks, plus 40+ plant networks across 5 regions, each with a health KPI.
- InfraOps (live) - one service-level view above network and server operations.
- ServerOps (in progress) - the ESXi and server estate, on the same pattern.
Service Analyzer, glass tables and a plant networks overview are in daily use - more value from the Splunk the Energy Company already owns.
Agents in Production
Named agents on fixed cadences - not a chatbot over dashboards - delivered through Microsoft Teams with automated notifications and reports.
| Agent | Cadence | What it does |
|---|---|---|
| Network Health | Daily | Health score, triage and ticket recommendations across Catalyst Center, Meraki, Mist, NDFC and Splunk. |
| VPN Health Check | Hourly | Gateway path, routing, authentication, session and IP checks - before users escalate. |
| CVE Exposure & Impact | Daily | Cisco PSIRT advisories matched to live inventory, with per-device risk classification. |
| Auto RCA | On demand | Incident analysis tied to ServiceNow tickets, correlated with Splunk and Dynatrace evidence. |
| Observability Gap | Continuous | Reachability and data-freshness checks across 25+ sources and 20+ Splunk indices. |
| NetworkOps & PlatformOps Copilots | On request | Route questions to the right use-case and micro agents. |
Results
| Area | Before Fabrix.ai | After Fabrix.ai |
|---|---|---|
| VPN disconnects | Playbooks, reboots and escalations; senior engineers searching ISE, ASA/FTD, FMC and Splunk | Root cause in ~3 minutes, with evidence - moving VPN RCA from Tier 3 to the Help Desk |
| VDI hangs | Weeks or months of blame between VDI and network teams | Load-balancer TTL / timeout identified as the likely cause in ~5 minutes |
| VPN estate health | Found after users complained | Hourly checks, with at-risk users flagged over a 24-48h window and RCA pre-run |
| CVE assessment | Days of manual cross-referencing per advisory | Minutes, with a daily automated scan |
| Observability gaps | Stalled indices and APIs went unnoticed | 9/9 tool reachability and 18+ indices monitored continuously |
| NOC effort | Shifts spent gathering evidence across 8+ tools | Agents do first-pass analysis; analysts focus on decisions |
For nearly 20 years, I have been waiting for a true single pane of glass. With Fabrix.ai, I am finally seeing it come to life - agents that reason across tools and tell us what is happening, why, and what to do next.
We are solving real Tier-3 problems in minutes, with evidence, using the systems we already run. That changes the conversation from who owns the issue to what action we should take next.
What's Next
With network and infrastructure operations in production, the Energy Company is extending Fabrix.ai into application operations, Help Desk triage and employee experience, with leadership positioning it as the long-term agentic operations layer.
- Ambient agents - scan for VPN, Wi-Fi, app access and telemetry issues before users escalate
- Help Desk triage - Tier 1 checks of a user, device, location, VPN state and likely root cause
- Employee self-service - users check their own device, VPN and app access