Modern AI Powered
Telco Service Assurance
Fault & Performance Management
Context & Challenges
Communication Service Providers (CSPs) and Telcos face intense pressure to ensure 24x7x365 operations, reliable service across complex multi-layer multi-vendor networks. Even brief disruptions cause significant financial losses and customer churn. Customers demand instant, reliable access, and contracts require consistent performance. Therefore, robust fault and performance management solutions are essential to minimize downtime, proactively address issues, and deliver the expected network experiences in today’s digital world.
- Legacy devices - non-standard outputs, lack of programmatic interface/APIs
- Multi-vendor: Diverse protocols, No standardized data model
- Large datasets, High volume
- Raw data - lacks context
Fault & Performance Management Module
Modern AI Powered Telco Service Assurance
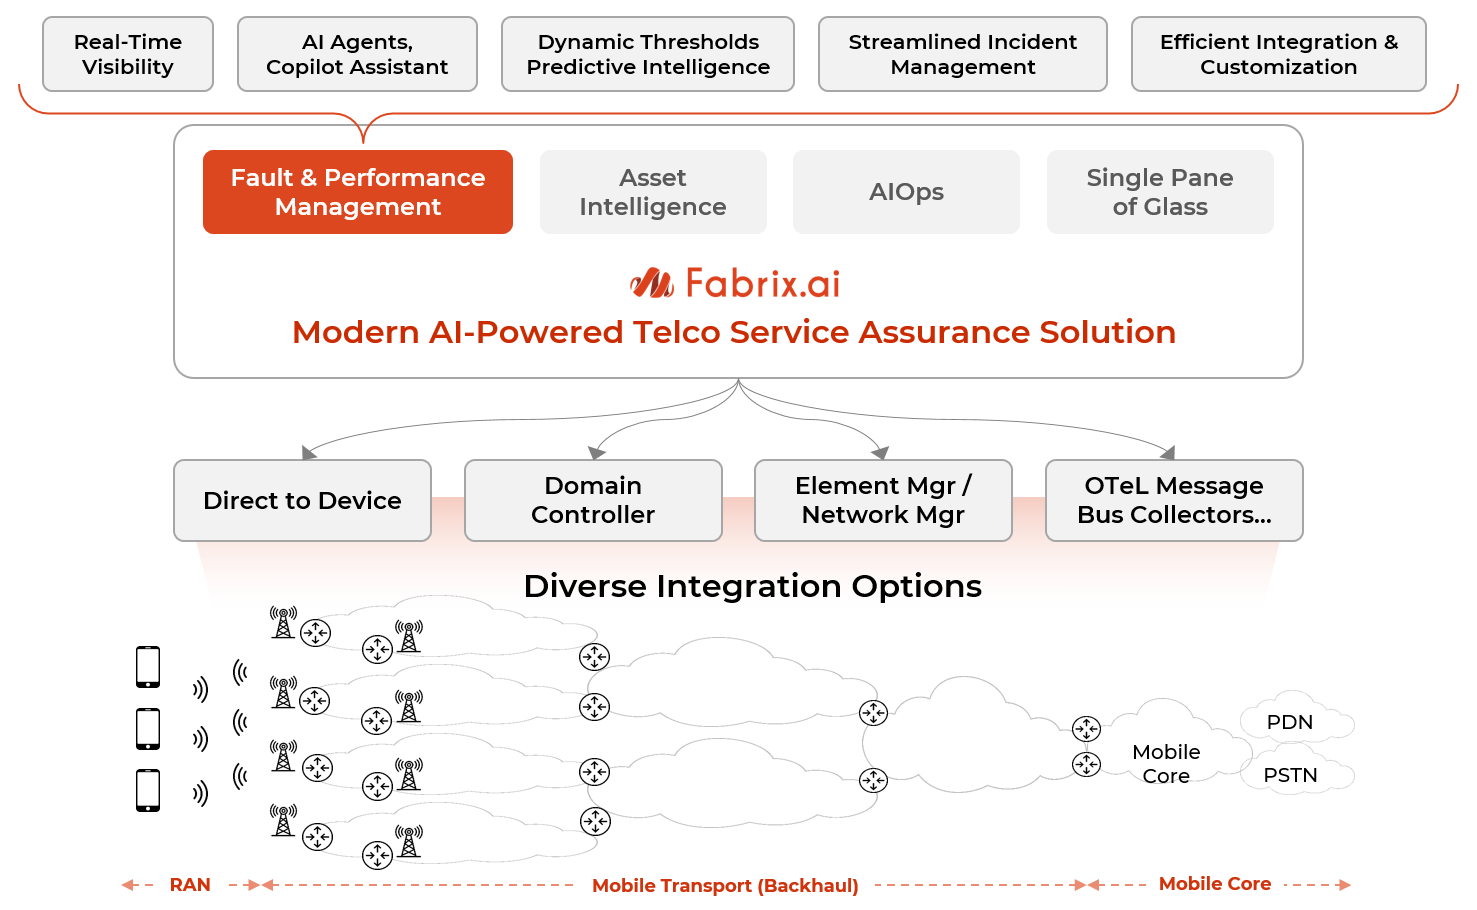
Fabrix.ai Telco Service Assurance (SA) is a modern, purpose-built operational intelligence solution. It’s Performance and Fault Management module delivers near real-time visibility, fault detection, and operational insights into the health and performance of multi-vendor, multi-layer networks used by Communication Service Providers (CSPs) and Telecom Operators.
- Real-Time Visibility
- AI-Driven Proactive Management
- Streamlined Incident Management
- Efficient Integration and Customization
- Flexible Deployment
Key Features/Highlights
| Category | Key Features |
|---|---|
| Real-Time Insights & Monitoring | Real-time performance and operational health insights |
| Ingestion of metrics, events, syslogs | |
| Real-time network topology and operational data overlay | |
| Geo mapping and Network data path visualization/traceability | |
| AI & Analytics | Anomaly detection, upper bound, lower bound deviations |
| Auto learning of baselines, seasonality & trends | |
| KPI forecasting and KPI workbench for on-demand analytics | |
| Predictive insights and alerting | |
| Intelligent Alerting & Incident Management | Intelligent alerting with dynamic thresholds |
| Auto alert rise and clear | |
| Alert deduplication and correlation across domains and full-stack | |
| Automated incident management with bi-directional integration with Ticketing Systems (ex: ServiceNow, PagerDuty, FreshDesk etc.) | |
| Automation & AI Agents | On-demand or trigger-based automation to invoke native or 3rd party workflows for diagnostics, data collection/verification, and remediation |
| Create your own agents with no-code. Pre-built agents include: Anomaly Detector Agent, Event Correlator Agent, and more. | |
| AI Copilot chat assistant to support conversational queries to automate artifact creation or respond to queries on operational data. | |
| Data Enrichment & Contextualization | Syslog/Event data enrichment and contextualization (ex: reasoning, suggested actions extraction from vendor KB) |
| Powerful Jinja2 and Mako templating engine for data/event processing and payload generation | |
| Built-in support for TextFSM templates enabling efficient processing and structured data extraction of device CLI outputs | |
| Visualization & Customization | Storyboards for creating appealing visualizations to convey outcomes, data/process flow covering multiple domains |
| Intuitive UI to upload any SNMP MIB to extract collection groups, notifications, scalars, tables, and compile MIB to JSON | |
| Easy to create or update SNMP profiles to customize inventory and performance data collection as per needs | |
| Reporting | Can export dashboards into reports (Excel/CSV/PDF) for offline processing |
| On-demand and Scheduling of reports. | |
| Dashboard report consisting of metric anomalies, log anomalies and more | |
| Integrations & Extensibility | Out-of-the-box integrations and solution packs with popular Infrastructure vendors and Network OS |
| Customizable low-code telemetry pipelines to integrate with any device/OS/vendor | |
| Scalability & Deployment | SSO, Multi-tenancy, RBAC and customer onboarding workflows |
| Provisioning/Orchestration: Kubernetes, RedHat Openshift, Helm charts, Docker Compose, Terraform | |
| Deployment freedom: on-prem, cloud, or hybrid |
Typical Integrations & Network Vendors
Integration Mechanisms
- Element Manager, Network Management System, Domain Controller
- Direct to device integration
- SNMP v1, v2c, v3
- SSH/CLI, REST APIs, Webhook, tcpjson, 3GPP
- Open Telemetry
- Syslog, rsyslog
- gRPC, gNMI dial-out, gNMI dial-in
- Cisco StarOS Bulkstats
- Messaging: Kafka, NATS.io, MQTT
- Logs/Events: Splunk, Filebeat, Winlogbeat, Fluentd, Collectd
- Open Source: Prometheus, Telegraf, Grafana, Zabbix
- Discovery/Topology Protocols: CDP, LLDP, ISIS, OSPF, BGP-LS
Network Vendors/Devices/OS
- Mobility: 4G, Cisco ASR 5500, PCRF, Gateway, PAS
- Optical: Cisco NCS 4200, L1, TDM, Mux ponders
- Managed Network Services (MNS): VMware Velocloud, Cisco SD WAN, Juniper, Vyatta, Fortinet
- Network OS: Cisco StarOS, IOS XE/XR, NXOS, Juniper JunOS, Arista EOS, HPE Provision or Comware
- Domain Controllers: Cisco DNA Center, Meraki, vManage, Nexus Dashboard, ACI APIC, Crosswork Controller
- Network Performance Monitoring: Prometheus, Telegraf, Grafana, Zabbix, PRTG
- Cisco: DNAC, DCNM, Meraki, SDWAN vManage, VMware VeloCloud
- IT Service Management (ITSM): ServiceNow, BMC Remedy, Jira, ManageEngine
- DEM & RUM Data: ThousandEyes, AppDynamics, Accedian Skylight, Splunk, ThousandEyes, APM tools like AppDynamics etc.
- Automation Platforms: Cisco NSO, BPA, Ansible, Terraform
- Devices: Firewalls, Load Balancers, Storage devices, Routers, Switches, Access Points, Wireless LAN Controllers, Servers, VMs, Guest OS, Containers, Microservices
Key Benefits

100% of your ops data & tool integrated
Increased availability, reduced downtime
MTTD/MTTR Reduction by 60% or more
Ability to predict/prevent impending issues
Intelligent alerting based on usage/trends
Alert deduplication and noise reduction
Productivity improvements with AI agents