Agentic Control Plane
Every AI interaction - traced, explained, and under control.
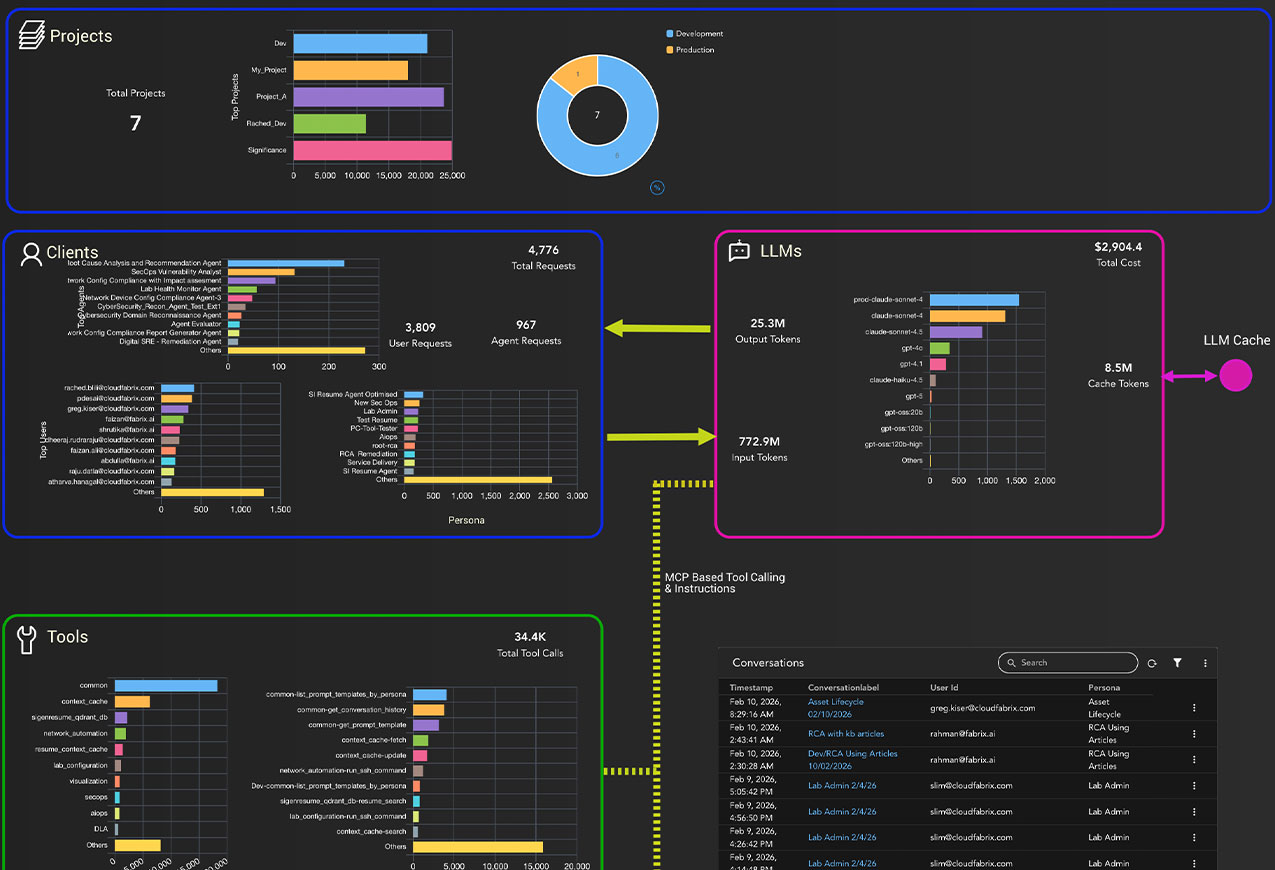
Enterprise-Wide Observability
One dashboard for AI across your
entire business - teams, apps, and providers.
See usage, outcomes, and spend at a glance, then drill into any team, agent, or run.
- Snapshot by department / team / app / provider
- Cost, requests, and tokens at a glance
- Leaderboards: top users, agents, personas
- Provider & model mix - share and trends
- One-click drilldowns: org → team → run
Cost & Token Insights
Know exactly where every dollar and token goes
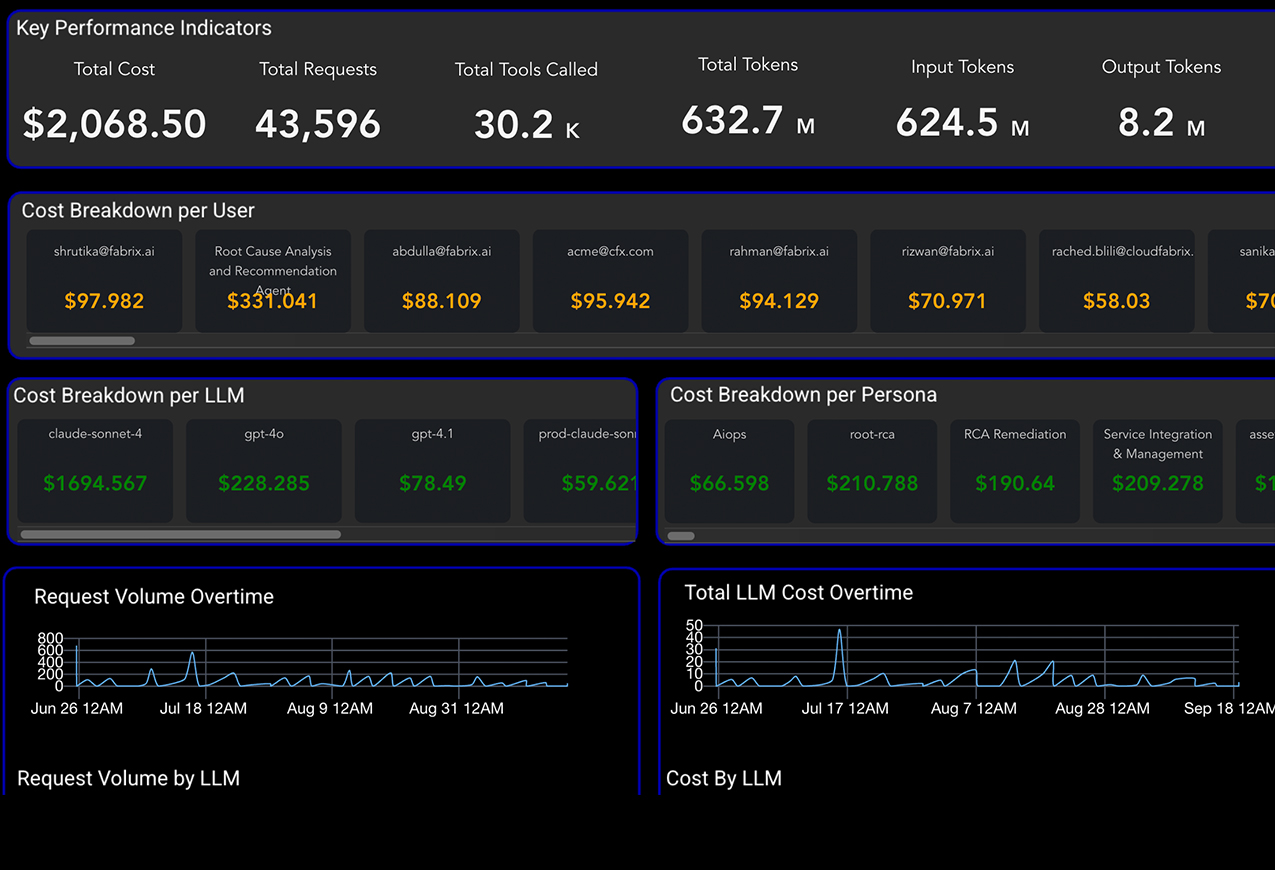
Slice by model, team, user, persona, or agent - then drill into any run to understand what drove the cost.
- KPI tiles: cost, requests, tools, tokens
- Cost by LLM / user / persona / agent
- Trends: volume & cost over time
- Tokens: input vs. output, cache savings
- Mix: provider share, agent vs. copilot, tool domains
- Reliability: success rate, failed-run cost
- Drilldowns: user & agent usage tables
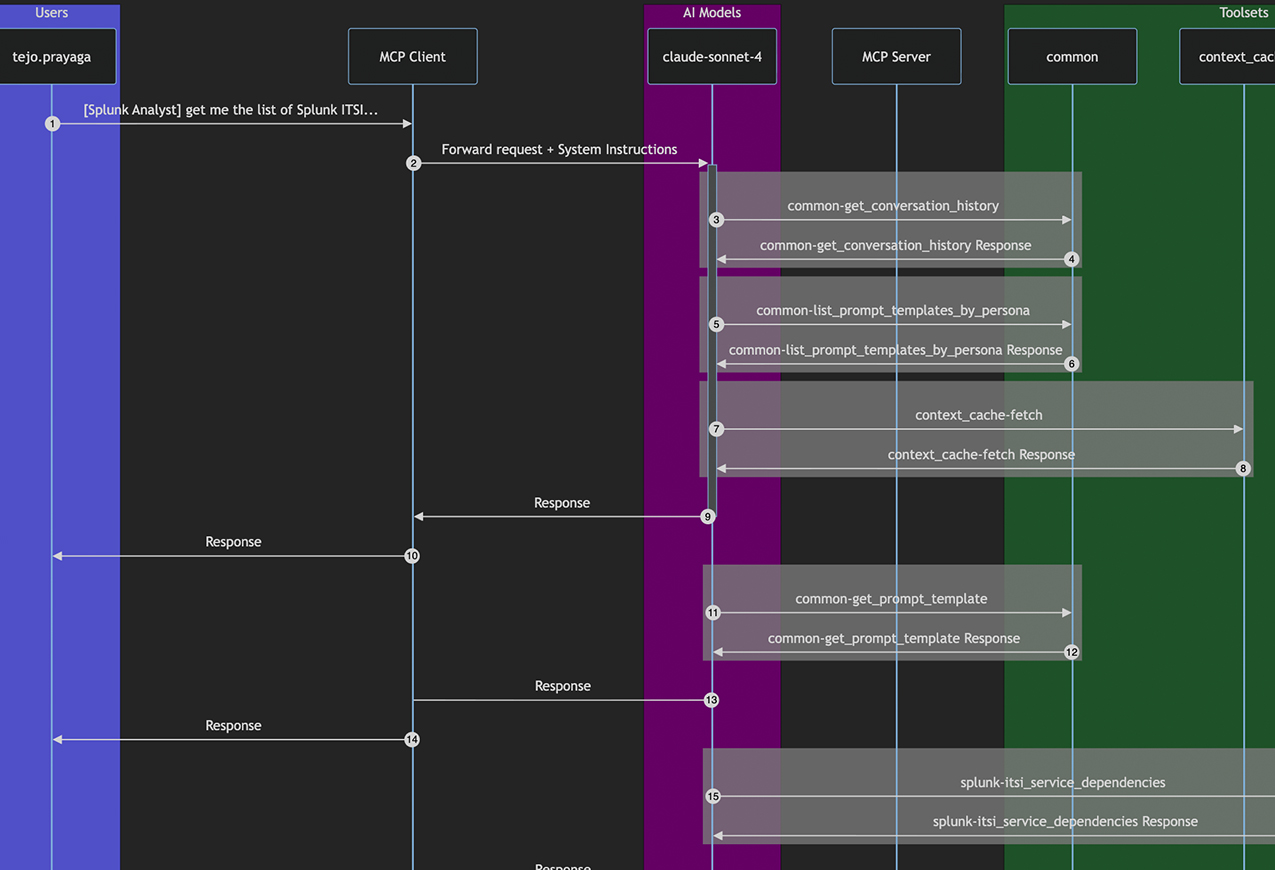
AI Interaction Flow Tracer
Every agent run leaves a complete trace - from the first prompt to the final action.
See every tool call, every model invocation, every branch and retry, with full payload visibility and PII masking built in.
- Persona → Prompt → Context → Tools → LLM → Result
- Payload view with redaction & PII masking
- Retries, fallbacks, branching and loops
- Latency breakdown per step - exportable traces
AI Explainability
Make every AI decision transparent, auditable, and defensible
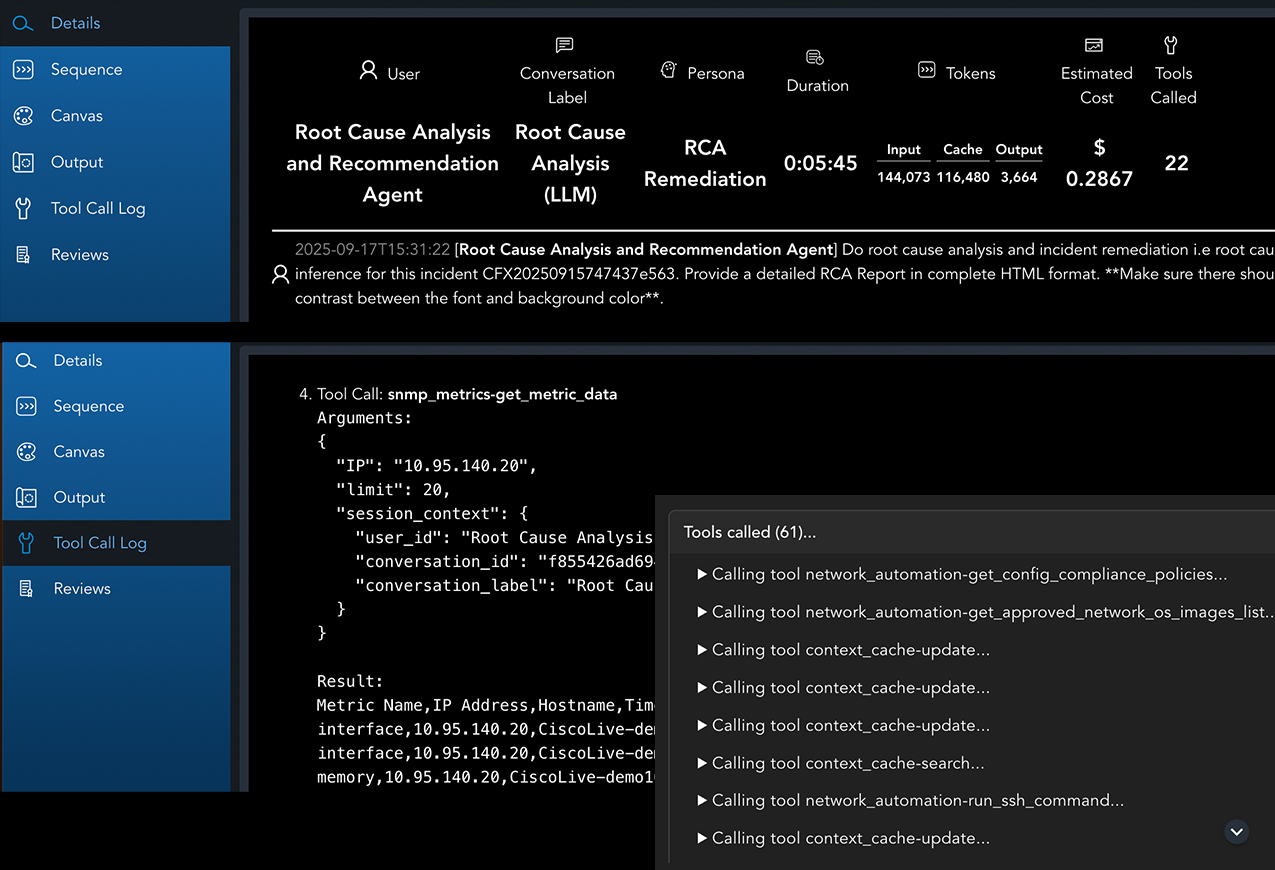
Every run includes a complete decision trace - reasoning chain, tool calls, evidence, and policy checks - so you can explain any outcome to any stakeholder.
- Chain of thought and full reasoning trace
- Tool call log with parameters and returned outputs
- Prompt & context snapshots - full LLM input/output view with redaction
- Run metadata: model, version, MCP tools, persona & scopes
Evaluators
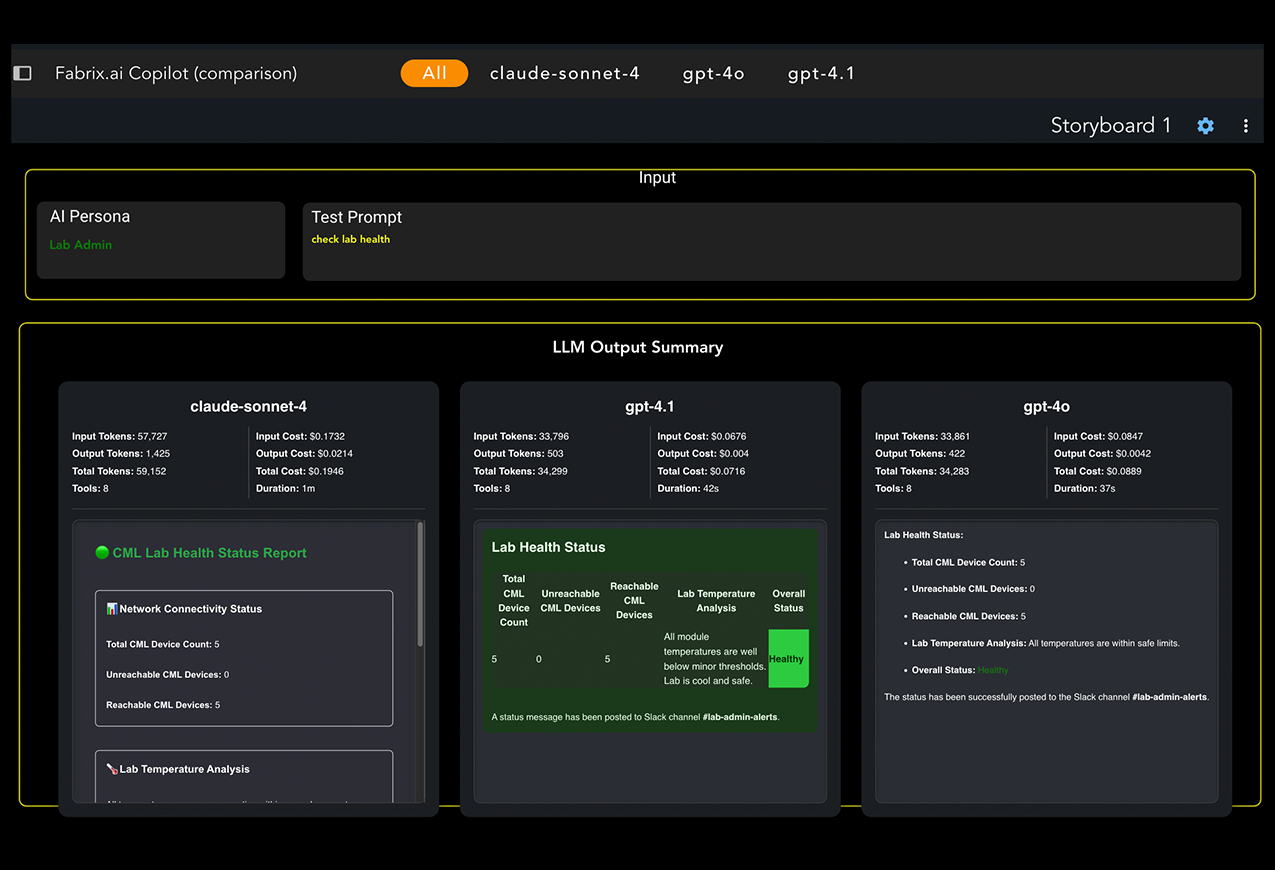
Don't guess which model is best for your use case - prove it
Run side-by-side model evaluations on your own data and rank quality, cost, and reliability before you deploy.
- A/B/C tests per use case
- Metrics: accuracy, factuality, coherence, safety
- Ops: tool calls, latency, tokens, $/result
- Human ratings + ground-truth scoring
- Leaderboards, recommendations, audit reports
Frequently Asked Questions
The Agentic Control Plane is the layer of the Fabrix.ai platform that traces, explains, and governs every AI interaction. It provides enterprise-wide observability, cost and token insights, interaction tracing, explainability, and model evaluators so organizations can operationalize AI agents at scale and keep every run under control.
It provides a single dashboard for AI across teams, apps, and providers. You can see usage, outcomes, and spend at a glance through snapshots by department, team, app, or provider, view leaderboards of top users, agents, and personas, compare provider and model mix, and drill down from org to team to individual run.
Cost and Token Insights let you slice spend by model, team, user, persona, or agent and drill into any run to see what drove the cost. It surfaces KPI tiles for cost, requests, tools, and tokens, trends for volume and cost over time, input versus output tokens with cache savings, provider share, success rate, and failed-run cost.
The AI Interaction Flow Tracer captures a complete trace of every agent run, from the first prompt to the final action. It shows the path from persona to prompt to context to tools to LLM to result, including retries, fallbacks, branching, and loops, with payload views, redaction and PII masking, and a per-step latency breakdown that can be exported.
Every run includes a complete decision trace with the chain of thought and reasoning, a tool call log with parameters and returned outputs, prompt and context snapshots with redaction, and run metadata such as model, version, MCP tools, persona, and scopes. This makes each outcome transparent, auditable, and defensible to any stakeholder.
Evaluators run side-by-side A/B/C model tests on your own data so you can prove which model performs best before deploying. They measure accuracy, factuality, coherence, and safety alongside operational metrics like tool calls, latency, tokens, and cost per result, combined with human ratings and ground-truth scoring, then produce leaderboards, recommendations, and audit reports.
Yes. Payload views in the Interaction Flow Tracer and the prompt and context snapshots in AI Explainability include built-in redaction and PII masking, so sensitive data is protected while teams retain full visibility into how each agent run executed.