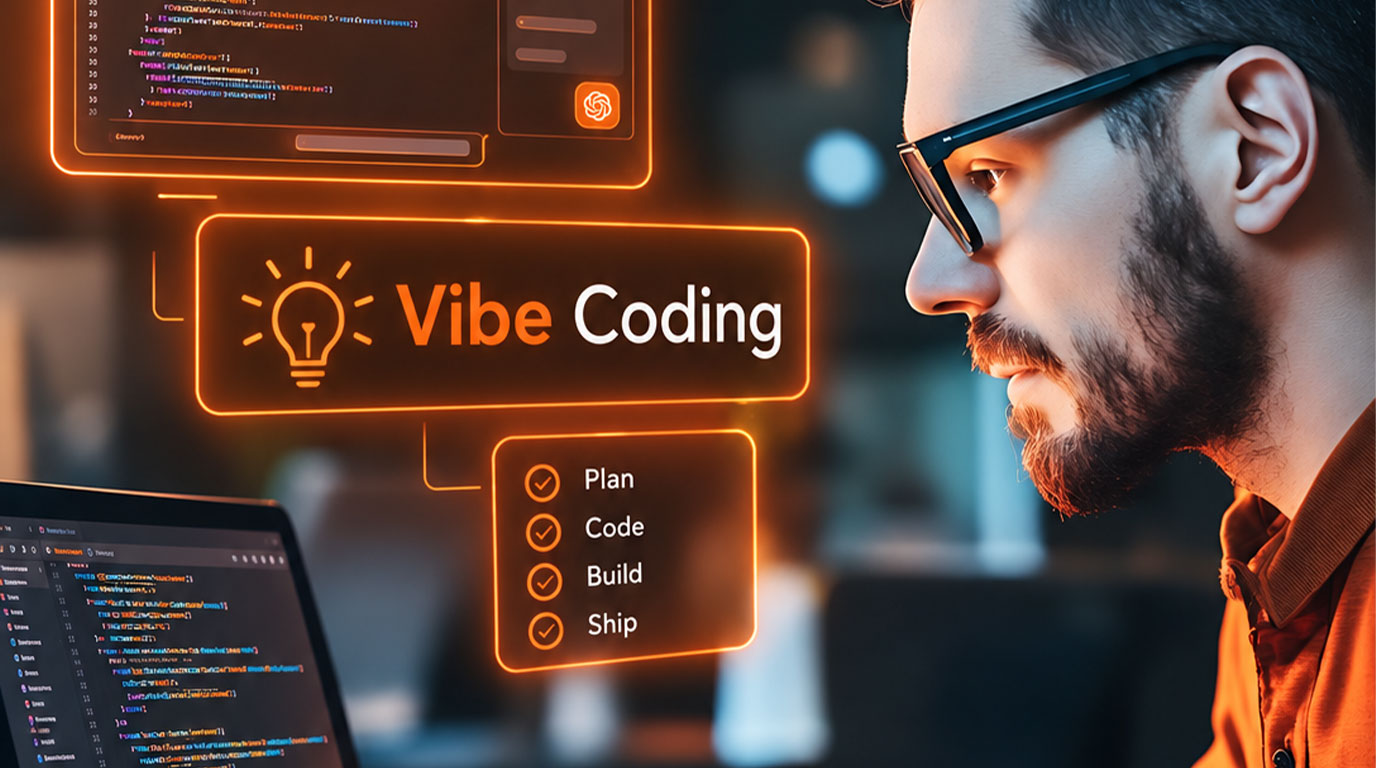
Come VibeCode Operational Artifacts with us
Describe the dashboard, agent or automation you need in plain language. Fabrix grounds it in your own telemetry, versions it, tests it, and gates it before anything reaches production. Minutes and hours - not quarters.
Reimagine your IT operations for the agentic era.
The use cases have not changed. Neither have the personas. What has changed is how fast the environment moves underneath them - and how you get to the outcome.
Nobody wants to be hostage to five vendor consoles.
Every domain tool ships its own static dashboard, its own query language and its own idea of what an incident is. Operators pay the difference in swivel-chair time.
Teams are asking for a bespoke experience built around their environment - not a general-purpose one built around a vendor's release schedule.
Infrastructure has to keep up with agentic.
Anthropic's Mythos finds software vulnerabilities autonomously at scale. OpenAI's Daybreak generates and tests patches inside enterprise repositories. Both landed within a month of each other in 2026.
AI systems are now proposing changes to production faster than most change-advisory processes can read them. Operations either governs at that speed or gets routed around.
Prototypes are easy. Production is the hard part.
Plenty of teams are already vibe coding ops tooling in Cursor or Claude Code. Almost none can operationalize it: no grounding in real data, no version control, no test gate, no audit trail, no cost ceiling.
Ungoverned, the speed becomes the liability.2
1 Customer-reported, first-year annualized figure across NetOps, AppOps, InfraOps and ServerOps. Methodology, baseline and domain-level breakdown available under NDA - ask for the ROI worksheet.
GigaOm named Fabrix.ai a Top 3 Leader and Outperformer in AIOps in its 2025 Radar. The platform underneath Governed VibeOps is not new - what is new is what your team can build on top of it.
Start from the tools you already run.
Governed VibeOps is a control plane around your existing stack, not a replacement for it. There are two ways in, and both end in the same place.
Then you already have the hard part.
Splunk, Dynatrace, ServiceNow, Cisco, IBM, AWS, NVIDIA - Fabrix connects at runtime through a universal MCP layer and hundreds of pre-validated integrations, then builds a living ontology across them. Your data stays where it is. What you gain is one place to ask a question that crosses all of them.

 + ITSM, observability, networking, cloud, databases
Then build on the platform directly.
Fabrix brings its own telemetry pipelines, data fabric and agentic workflow engine. You build applications on top of the infrastructure analytics rather than assembling a stack first - from the ground up, or by refining an artifact someone on your team already built.
How an artifact runs, once it is live
Data enrichment
Raw signals gain the context that makes them answerable.
Across sources
Multi-vendor operational data queried in place, not centralized.
Agents & approvals
Domain micro-agents, workflows and the human gates between them.
On your ontology
A living model of your environment, not a stale CMDB.
Inside guardrails
Controlled remediation, every action logged and attributable.
| Domain | What your team builds in the first week | Grounded by |
|---|---|---|
| ITOps / SRE | Correlation and triage agents that reason over your own topology and runbooks, and remediate inside guardrails. | Argos AIOps |
| NetOps | Scheduled config and ACL audits, VPN and path troubleshooting, change-risk scoring before the window opens. | Argos VX |
| SecOps | CVE findings enriched with real exposure context, so patch effort targets reachable risk. Every action logged. | Argos VE |
| ServiceOps | Case, knowledge and asset-ownership agents that close tickets without routing around change policy. | Argos AIOps |
| DataOps | Prep and quality agents that keep the data every other agent depends on current and trustworthy. | Argos VX |
| BizOps | RevOps and FinOps views that tie an outage to the revenue and customer experience it actually cost. | Argos VX |
Argos models are sovereign by design: a frozen open-weight foundation plus a small adapter trained on your incidents, runbooks and configs. You own the adapter, run it on a single GPU where your data lives, and offboarding is deleting a file - verifiable removal of everything the model learned from you. Up to 100× cheaper per token than frontier closed models, which is what makes always-on ambient agents affordable.
Five steps to production, and none of them are optional.
This is the governed loop. It is a sequence because production is a sequence - an artifact cannot skip a gate to get there faster.
Generate
Use the coding agent you already like - Cursor, Claude Code, Codex, OpenCode, AntiGravity - or the built-in vibe coding environment. Point it at your Fabrix workspace and describe the artifact in natural language.
Version
Every artifact lands in version control from the first generation. Diffs are readable, changes are summarized in language a change board can act on, and rollback is a commit rather than an incident.
Test
Run the artifact against grounded data and your own historical incidents before it sees live traffic. Evaluation is part of the loop, not a follow-up project.
Automated, plus the owning teamReview
A human approves what data the artifact may touch, which workflows it may run and which actions it may take unattended. The approval is recorded against a named person and a role-based policy.
Promote
Promotion to production carries SSO, high availability, geo-DR, full observability of agent actions and query cost, and data lineage - inherited from the platform, not rebuilt per app.
# 1 - point your coding agent at the Fabrix workspace
  fabrix workspace init acme-netops

  # 2 - connect the tools you already run (read-only to start)
  fabrix connect splunk      --index main --scope read
  fabrix connect servicenow  --instance acme --scope read
  fabrix connect dynatrace   --env acme-prod --scope read

  # 3 - describe the artifact, grounded in the connected data
  fabrix build "dashboard: WAN edge health by site, last 24h,
    flag any ACL change within 30 min of a latency spike"

  # 4 - test against your own historical incidents
  fabrix test wan-edge-health --replay incidents/2026-Q2

  # 5 - open for review; promotion requires a named approver
  fabrix promote wan-edge-health --to prod --request-review
Watch someone build one first.
A short walkthrough library covering the connect-and-build moment, the governance gate, and a full domain scenario end to end. Access is granted on request to customers, partners and evaluators.
Connect and build
Point a coding agent at a Fabrix workspace, connect Splunk and ServiceNow, and generate a working operational dashboard from a single prompt.
The governance layer
Inspect, test and review the same artifact - then watch a promotion get blocked, and see exactly why and by which policy.
Domain scenario, end to end
A NetOps drift investigation from alert to root cause to governed remediation, against a real multi-vendor environment.
Governance runs in the execution path, not the policy document.
The enterprise does not have a vibe coding problem. It has a vibe governance problem. Fabrix governs at two levels, and they do different jobs.
Ground the tools in your environment.
- Artifacts are generated against your datasets, your topology and your schemas - not a general model's guess at them
- Scoped data access: what an artifact may read, and from which connected system
- Action authorization and traceability on every agent decision
- Spend and token ceilings - deterministic work runs as pipelines with no inference cost at all
- Lineage, retention and compliance as platform services, not per-app projects
Gate what reaches production.
- Version control from the first generation, with summarized diffs
- Evaluation against grounded data and historical incidents before promotion
- Named human review of data scope, permitted workflows and unattended actions
- Role-based permissions on who may create, review, promote or execute
- Full audit trail: what ran, what it touched, who approved it
2 Gartner predicts that by 2028, prompt-to-app approaches adopted by citizen developers will increase software defects by 2,500%, triggering a software quality and reliability crisis. Governed VibeOps is built to close that gap rather than widen it.
Bring one use case. Leave with a governed artifact.
Pick the workflow your team argues about most - the recurring VPN escalation, the config drift nobody catches until Friday, the CVE backlog with no exposure context. Bring that one. Build it with us.
Meet the team in person at Splunk .conf, September 14–17, Denver.
Connect and Build
0:00-0:35 - Cold open, no logo
If you run operations, you already have five consoles open. Splunk for logs. ServiceNow for tickets. Dynatrace for traces. A network manager. And a spreadsheet somebody maintains by hand.
Nothing here replaces any of those. In the next six minutes I'm going to connect three of them and build a working operational dashboard that reads across all three - without moving a single byte of data out of where it lives.
0:35-1:30 - The workspace
This is a Fabrix workspace. It is not a new tool your team has to learn. It is the place your coding agent points at.
I'm using Claude Code here. It works the same with Cursor, Codex, OpenCode or Antigravity - bring the one your team already uses. The agent isn't guessing about your environment; it's reading a live ontology built from the systems we're about to connect.
1:30-3:00 - Connect three systems
Splunk first. Read-only scope, one index. Notice what I did not do: no agent install, no data export, no forwarder change.
ServiceNow. Same pattern - read scope, one instance.
Dynatrace, production environment.
Three systems, ninety seconds. Behind that, Fabrix has over a thousand pre-validated integrations, and a universal MCP layer that handles APIs, devices and telemetry at runtime. The validation matters more than the count - these are tested against real enterprise schemas, not a docs page.
3:00-5:15 - Build the artifact
Now the part everyone came for. I'm going to describe what I want in English.
"Dashboard: WAN edge health by site, last twenty-four hours. Flag any ACL change that happened within thirty minutes of a latency spike."
That prompt crosses three vendors. The site list is coming from the network manager. The latency series is Dynatrace. The change records are ServiceNow. Six months ago that was a Tuesday afternoon and a JIRA ticket.
There it is. And here's the thing I want you to notice - it is grounded. The site names are your site names. The severity thresholds are the ones already in your alerting policy. It didn't invent a schema; it read yours.
5:15-6:30 - The honest caveat, then the close
This is not in production yet, and it should not be. What I have is a generated artifact, and a generated artifact is a prototype until it has been versioned, tested, reviewed and promoted. That's the next video, and it's the one that actually matters.
If you want to try this against your own stack, the link is on screen. Bring one use case - the recurring escalation your team argues about. Not ten.
Connect and Build
0:00-0:35 - Cold open, no logo
If you run operations, you already have five consoles open. Splunk for logs. ServiceNow for tickets. Dynatrace for traces. A network manager. And a spreadsheet somebody maintains by hand.
Nothing here replaces any of those. In the next six minutes I'm going to connect three of them and build a working operational dashboard that reads across all three - without moving a single byte of data out of where it lives.
0:35-1:30 - The workspace
This is a Fabrix workspace. It is not a new tool your team has to learn. It is the place your coding agent points at.
I'm using Claude Code here. It works the same with Cursor, Codex, OpenCode or Antigravity - bring the one your team already uses. The agent isn't guessing about your environment; it's reading a live ontology built from the systems we're about to connect.
1:30-3:00 - Connect three systems
Splunk first. Read-only scope, one index. Notice what I did not do: no agent install, no data export, no forwarder change.
ServiceNow. Same pattern - read scope, one instance.
Dynatrace, production environment.
Three systems, ninety seconds. Behind that, Fabrix has over a thousand pre-validated integrations, and a universal MCP layer that handles APIs, devices and telemetry at runtime. The validation matters more than the count - these are tested against real enterprise schemas, not a docs page.
3:00-5:15 - Build the artifact
Now the part everyone came for. I'm going to describe what I want in English.
"Dashboard: WAN edge health by site, last twenty-four hours. Flag any ACL change that happened within thirty minutes of a latency spike."
That prompt crosses three vendors. The site list is coming from the network manager. The latency series is Dynatrace. The change records are ServiceNow. Six months ago that was a Tuesday afternoon and a JIRA ticket.
There it is. And here's the thing I want you to notice - it is grounded. The site names are your site names. The severity thresholds are the ones already in your alerting policy. It didn't invent a schema; it read yours.
5:15-6:30 - The honest caveat, then the close
This is not in production yet, and it should not be. What I have is a generated artifact, and a generated artifact is a prototype until it has been versioned, tested, reviewed and promoted. That's the next video, and it's the one that actually matters.
If you want to try this against your own stack, the link is on screen. Bring one use case - the recurring escalation your team argues about. Not ten.
The Governance Layer
0:00-0:40 - The thesis up front
Gartner's position on this is blunt: prompt-to-app development by non-developers is on track to increase software defects by twenty-five hundred percent by 2028. Our CEO's version is shorter - the enterprise doesn't have a vibe coding problem, it has a vibe governance problem.
So let's talk about what actually gets governed, because "governance" on a slide is worthless.
0:40-2:00 - Level one: the harness
There are two levels and they do different jobs.
Level one is the platform. Every artifact is generated against your data, your topology, your schemas. That is a governance control, not a convenience feature - a model that can't see your environment will confidently invent one.
At this level we also scope what an artifact may read, from which system, with what credentials. And we put a ceiling on spend: work that is deterministic runs as a pipeline with no inference cost at all. Agentic work is scoped and bounded. You are not discovering your token bill at the end of the month.
2:00-4:30 - Level two: the loop
Level two governs the code path. Five steps.
Generate - that was the last video. Version - the artifact went into version control at first generation, and here's the diff, summarized in language a change board can read. Test - I'm replaying it against our own Q2 incidents, not synthetic data. Review - a named human approves what data it touches, what workflows it can run, and what it may do unattended. Promote - and promotion carries SSO, high availability, geo-DR, observability and lineage inherited from the platform. Nobody rebuilds those per app.
4:30-6:30 - Break it on purpose
Now watch this. I'm going to add a remediation action to this dashboard - push an ACL rollback automatically when it detects drift.
And promotion fails.
Read the reason: the artifact requested a write scope on a production network device, and the approving role doesn't carry that permission. Nothing crashed. Nothing was silently downgraded. A policy said no, and it named which policy and who can say yes.
That is the whole product in one screen. The speed you saw in the last video is only worth anything if this screen exists.
6:30-8:00 - Where the SLMs fit, and close
One more piece. What's grounding all of this is Triton - our family of small, domain-expert models. A frozen open-weight foundation, plus a small adapter trained on your incidents, your runbooks, your configs.
Three things follow from that shape. It's sovereign - you own the adapter, run it where your data lives, and offboarding is deleting a file. That's verifiable removal, which a full fine-tune or a shared model cannot promise you. It's accurate, because it's expert in one domain instead of average across all of them. And it's cheap enough to leave running - which is what "ambient agent" actually requires.
Governance in the execution path, not the policy document. That's the difference.
Domain Scenario, End to End
0:00-1:00 - The before
Here is how this investigation goes today.
A site reports intermittent packet loss. The NOC opens Splunk, filters, finds nothing conclusive. Opens the network manager, pulls the config, eyeballs it. Opens ServiceNow, searches for recent changes at that site. Forty minutes in, someone remembers a similar incident in March and goes looking for the ticket.
Four consoles, two people, no root cause yet. This is not incompetence. It's the tooling.
1:00-2:00 - The ask
Same incident, one question:
"Site DFW-04 is reporting intermittent packet loss since roughly 14:00. What changed, what else is affected, and has this happened before?"
2:00-5:30 - The investigation
Narrate the agent's actual reasoning path as it runs. Do not pre-script the findings.
It's pulling the interface counters. Cross-referencing the change log. And there - a config push at 13:52 that modified an ACL on the upstream edge.
Now watch it check blast radius. Three other sites share that edge device. Two of them are showing early- stage degradation nobody has paged on yet.
And it found the March incident. Same device, same class of change, same symptom. The runbook from that resolution is attached.
5:30-7:30 - What it does not do
Notice what has not happened. It has not rolled anything back. It has not touched a production device.
It has produced a finding, a blast radius, a precedent, and a proposed remediation - and it has stopped at the guardrail, because remediation on a production network device requires a named approver. Here's the approval. Here's the action. Here's the audit record, permanently attached to the incident.
7:30-9:30 - The economics, stated plainly
One customer running this across NetOps, AppOps, InfraOps and ServerOps reported one-point-two-three million dollars in annualized return in the first year.
I'd rather you interrogate that number than accept it. Ask us for the worksheet - the baseline, the methodology, which domain contributed what. If a vendor gives you an ROI figure and no methodology, you should not believe them, and that includes us.
What I'd point you at instead is the mechanism, because that's what transfers to your environment: fewer three-a.m. pages, root cause in minutes instead of a shift, drift caught before the change window closes, and patch effort aimed at reachable risk instead of a CVE count.
9:30-11:00 - Close
The takeaway isn't that agents are fast. Everyone's demo is fast.
The takeaway is that an agent is only useful in production when it has trusted context, cross-domain reach, a governance gate it cannot route around, and a human who stays in control of the consequential actions. Those four together - that's Governed VibeOps.
Bring us one use case. The recurring escalation. The drift nobody catches until Friday. The CVE backlog with no exposure context. Bring that one, and let's build the artifact together.